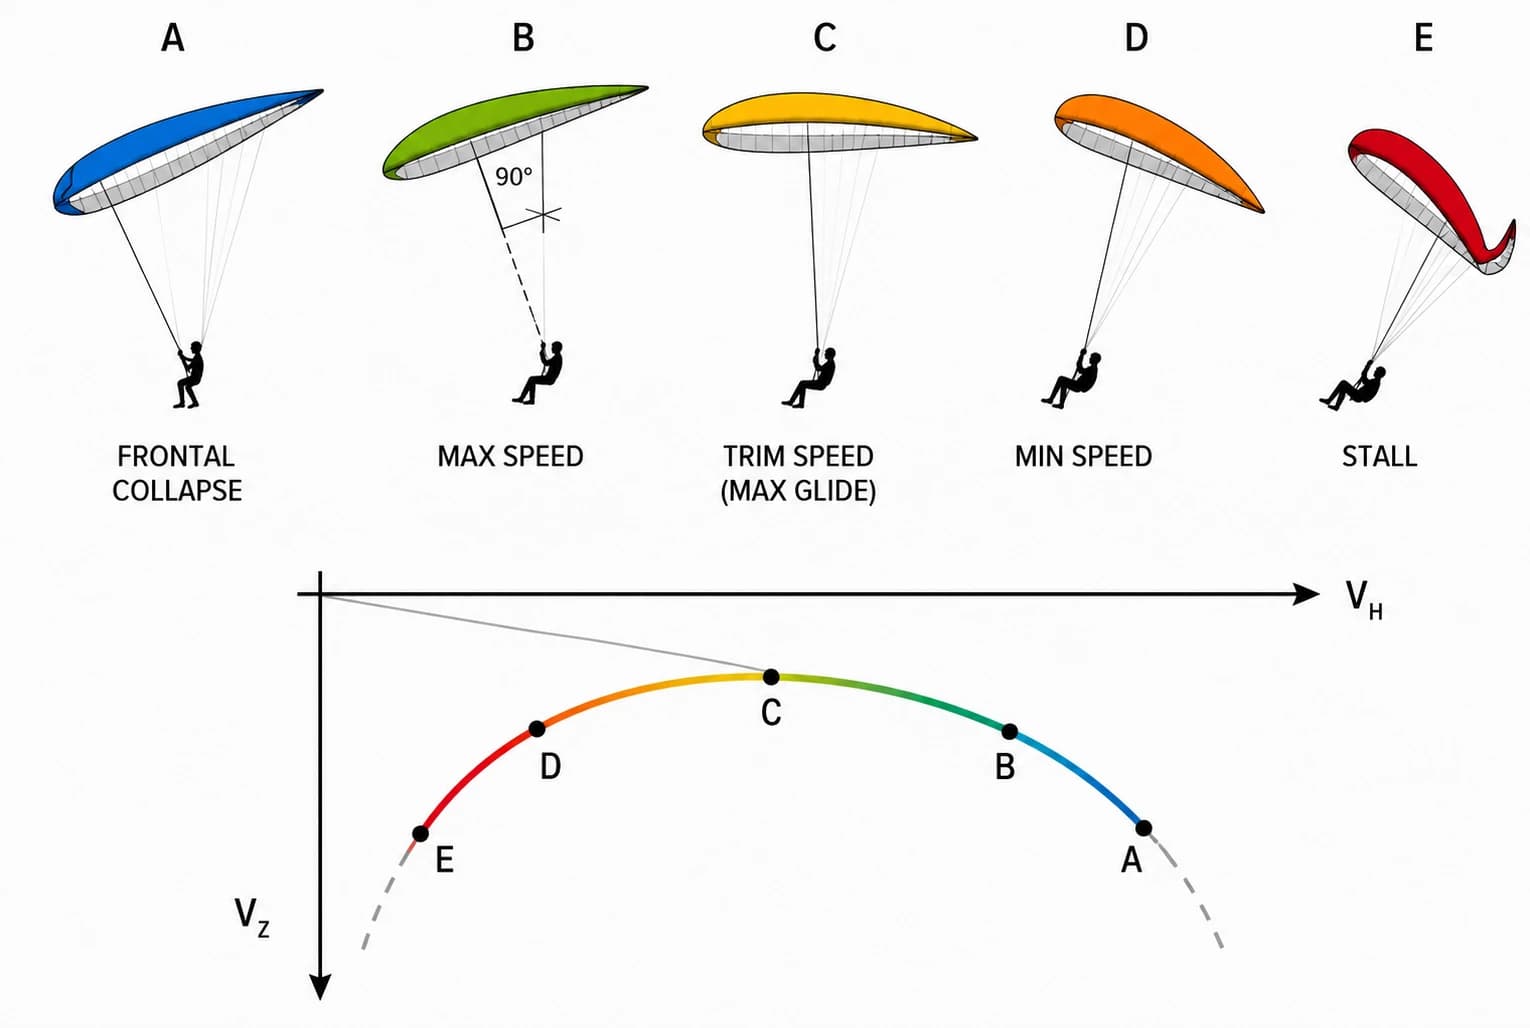
To construct a usable polar curve for a paraglider, or a hang glider, is not necessarily an easy task. The first prerequisite is absolutely calm air – not a common occurrence anywhere. Second is a good memory, or simply a Dictaphone, a vario and a speed probe. Early mornings offer the best chances of recording an accurate polar curve. I won‘t even begin to list all the possible errors that may adversely influence the final result. It is important to know how the polar curve looks in principle. That is useful for optimising our gliding in different situations – it doesn‘t matter so much if the actual polar is dead accurate or not.
🛠️ How a polar curve is acquired
In order to get a sufficient number of coordinates in our coordinate system to draw the polar we simply fly at all the speeds our wing is capable of (for example in 2km/h increments), all the time recording the descent rate corresponding to the different speeds. Once we have all the values (speed/descent) we plot them into the coordinate system. Illustration 10.2 shows a table where the values for a modern sports-class wing have been entered. Notice that both axis‘ are in m/s, so we‘ll have to convert our speed measurements into m/s before entering them into the table. With these numbers we can also calculate our L/D ratio, often referred to as our glide ratio, by dividing A (speed) with B (descent rate).
🦅 How to glide the furthest?
This question is of elementary importance to the XC pilot, particularly when crossing difficult areas. If we‘re crossing a wide valley we normally want to arrive at the other side as high as possible so that we increase our chances of locating lift and continuing the flight. The wing in the example above has an approx. trim speed of 40km/h, at least with the wing loading used for the polar measurements. The best glide angle is calculated to 9.6 in the table. If there‘s absolutely no wind this is then the best speed to glide for long transitions. Note that most paragliders are designed to have their best glide in calm air with the brakes untouched and no speed bar applied.
If in doubt it is always better to glide a little too fast than a little too slow.
— Bukhard Martens
In my personal experience: when flying downwind in weak thermals, the optimal setting is 1/3 speed bar. With no wind, I apply 1/2 bar. If the thermals are moderate and I am safely inside one, I push 3/4 bar to accelerate. If the thermals are strong, I always use full speed bar, even when flying downwind. When flying into a headwind, I can still climb easily on full bar. This rule applies to all high-performance wings; however, for gliders that experience a sharp increase in sink rate when accelerated, caution is needed to optimize the glide.
— Burkhard Martens
🔝 Optimising the climb using the polar curve
It doesn‘t take a degree in maths to work out that the best speed for thermalling is as close to the minimum sink speed as possible. If we return to the example from the previous page it is easy to see that for this particular wing the minimum sink is around the 38km/h mark, in fact not very far from the speed for best glide. It always surprises me when I meet or overhear people saying something along the lines of "there I was with the brakes buried almost to my hips and the others were still climbing better!" One glance at the table is enough to tell us that we get absolutely nothing out of flying too slow.
💨 How to glide with a headwind
If we look at a headwind situation from a polar curve view, we simply change the origin of the tangent line on the X-axis corresponding to the wind speed. The tangent touches the curve further down the slope, indicating that the optimal speed for gliding against the wind is higher than when we wish to go far in calm air.
💡 Practical hints - headwind: If there is up to 10km/h headwind we use only a little speed to 1/3 bar. Around 20km/h it pays to speed around 2/3 of the full range of the speed system, and only when the headwind reaches 30km/h it is worth it to go at fullspeed.
⚠️ NOTE: It is good to be aware of the fact that the glide ratio is severely affected by a headwind. If the wing in the example above flies into a 20km/h headwind the glide ratio is only half of what it would get in calm air, and at 30km/h it is down to an L/D of 2.6. This translates into the understanding that even small valley crossings are all but out of the question if there‘s a strong head wind. 📌 Additional Note: In real-life flying it is rare to be going at full speed on a paraglider. It is only necessary if there‘s a venturi effect stopping us from getting over or around a spur or similar – or on final glides in competitions.
📌 Hint - Crosswind: When flying with a lateral wind we must go slightly sideways ("crabbing") in order to counter the drift. Note that the headwind rules apply – we must speed up to reach best glide. The more lateral wind, the faster we must fly to optimise our glide angle.
⏬ How to fly in a descending air mass
We can also use the polar curve coordinate system to work out how to fly through sinking air. To do this we must move the origin of the tangent up the Y-axis corresponding to the descent rate we meet. Again it is clear to see that the tangent touches the graph further right, indicative of the need to speed up in sinking air.
💡 Practical hints – sinking air: If the surrounding air is sinking 1m/s (the vario is showing app. –2.1m/s and the glide-ratio reduced nearly to the half!!!) we should accelerate 1/2 to 2/3. Once the needle hits -3m/s, corresponding to a surrounding airmass sinking with 2m/s, we must go very fast to escape.
— Bukhard Martens
⚠️ NOTE: When flying through an airmass sinking 2m/s our glide angle is reduced to something like 3.4 almost regardless of whether we‘re going 40 or 50km/h! This means that getting out of the sinking airmass is top priority, either by speeding up or by changing heading. Aside from that we can only hope that we can get through it before we run out of air to fly through.
📌 Hint: If we find ourselves low and desperate it pays to search downwind, i.e. with a tailwind even if it means flying back the way we came from for a while, as this allows us to explore a far greater area than if we keep insisting on going against the wind. It is better to fly a long detour than to be sitting on the ground!
📌 Hint: Because air density decreases with altitude, your true airspeed will increase by about 6% for every 1,000 meters you climb. This is an advantage that allows you to fly further, as you will be moving faster at higher altitudes. However, the most important factor to reach those heights is having strong thermals.
🚀 How to deal with a tailwind
Gliding with a tailwind is great; it gives the impression that one can go on forever. If we look at the coordinate system again we can see that the origin of the tangent line is shifted left, which means that the tangent touches the speed polar curve further left as well. Further left is closer to the speed for minimum sink so it follows that it pays to slow down a little in a tailwind. Notice that the gap between speed for best glide and speed for minimum sink is narrow on modern wings so don‘t overdo the braking part – on the wing used in the examples above we should never slow down to an airspeed of less than 38km/h as this just makes the descent rate increase again!