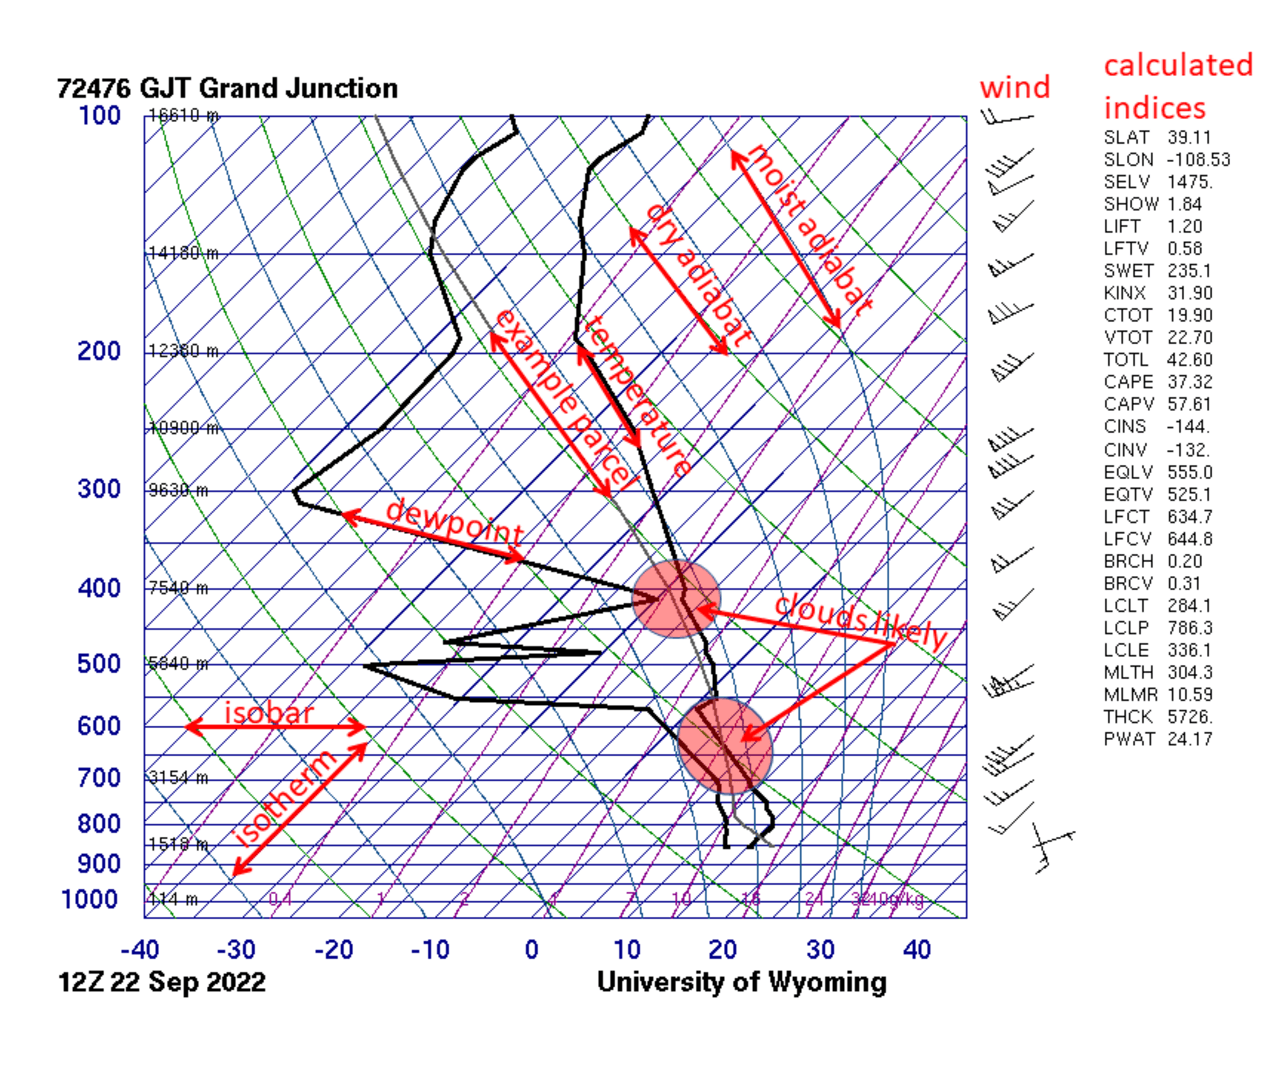
The Skew-T log-P diagram (in Europe you'll often see the emagram variant) is a snapshot of the whole column of air above your site – from the ground to ~16 km – at one moment. For a paraglider pilot it is the only tool that shows, on a single picture, how high thermals will go, where cloud will form, whether an inversion caps the day, and whether this afternoon turns into a storm. This article is a paragliding rewrite of meteorologist Jeff Haby's guide (as published on Portugal Paragliding), dropping the tornado and hail forecasting material and adding a practical reading routine for a flying day in Vietnam.

1. What a Skew-T is and where to get one
A Skew-T plots temperature against pressure (height). The vertical axis is pressure on a log scale (1050 → 100 hPa, i.e. ground → ~16 km); the horizontal axis is temperature, but the isotherms are tilted 45° to the right ("skewed") so the real temperature trace isn't squeezed into a corner. The emagram differs only in drawing the temperature axis vertically; everything below applies to both.
There are two kinds of sounding:
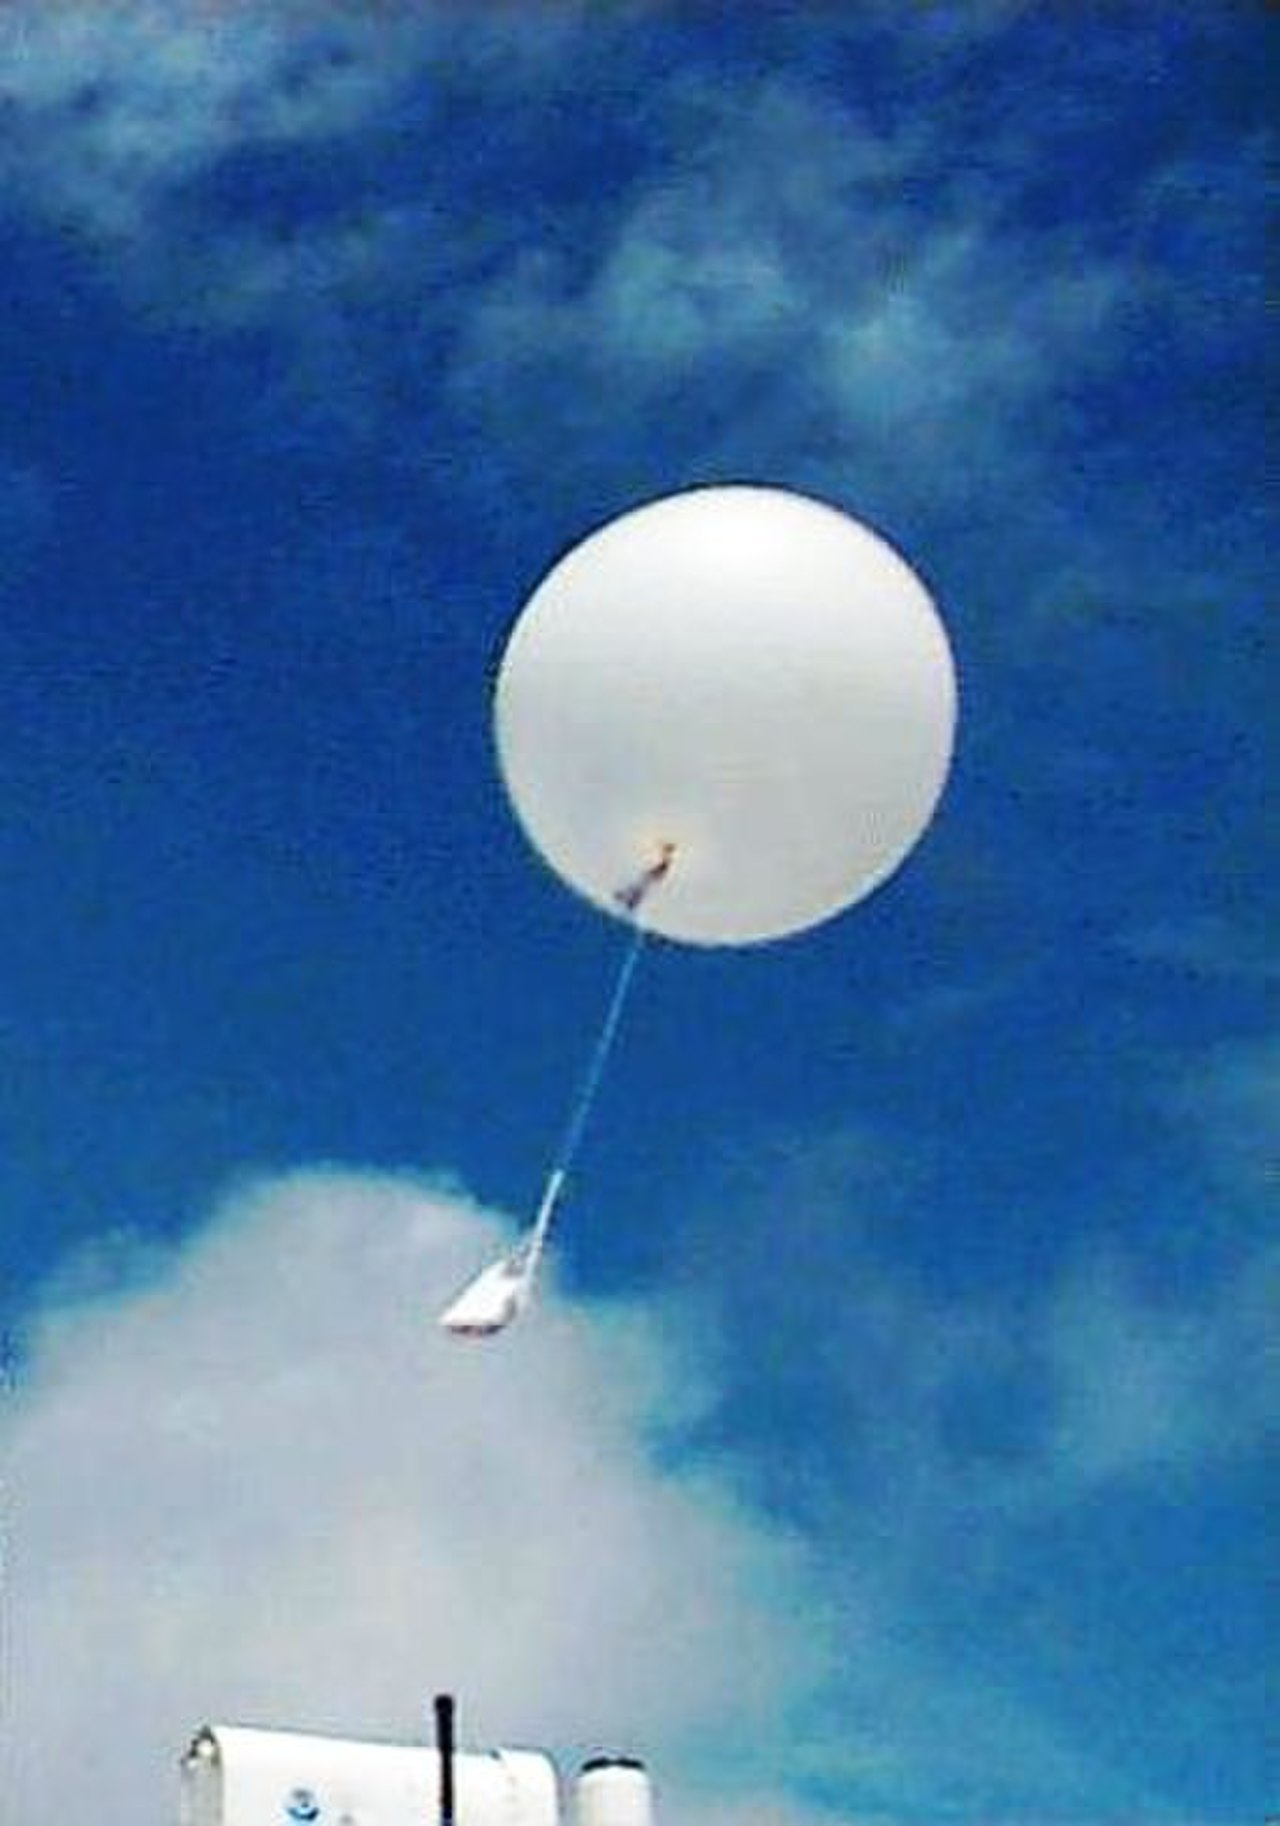
- Observed soundings from radiosonde balloons, launched at 00Z and 12Z (07:00 and 19:00 Vietnam time). Accurate but only twice a day, and the nearest station may be hundreds of km from your site.
- Model soundings (ECMWF, GFS, ICON…) computed for the exact launch coordinates, hourly, days ahead. This is what pilots use daily: Windy (click the point → "Sounding" tab), meteoblue (Air → Sounding/Emagram), XC Skies, SkySight.
One weakness to remember: model soundings use smoothed terrain on a 9–13 km grid. The model's surface temperature at Khau Pha or Sapa is typically 2–4°C lower than reality on a south-facing rocky slope – so real thermals are usually a little stronger and higher than the model says.
2. The nine kinds of lines on the chart
| Line | How to recognise it | What it is | Pilots use it to |
|---|---|---|---|
| Isobars | Horizontal, spacing shrinks with height | Pressure levels 1000, 925, 850, 700, 500, 300 hPa | Convert to height: 925 ≈ 750 m, 850 ≈ 1,500 m, 700 ≈ 3,000 m, 500 ≈ 5,500 m |
| Isotherms | Straight, tilted 45° right, every 10°C | Equal temperature | Read temperature at each level; find the 0°C line (freezing level) |
| Dry adiabats | Gently curved, leaning left | How an unsaturated parcel cools as it rises: 9.8°C/km (~1°C/100 m) | The thermal's path from the ground to cloudbase |
| Moist adiabats | More curved, steeper than dry adiabats | How a saturated parcel cools: 4–9.8°C/km depending on temperature (~5–6°C/km in the hot humid tropics) | The cumulus path from cloudbase to its top |
| Saturation mixing ratio (dashed) | Nearly vertical, slightly right-leaning, in g/kg | Maximum water vapour the air can hold at that temperature and pressure | Follow it up from the surface dew point to find cloudbase |
| Environmental temperature (T, red, bold) | Jagged line on the right | The real air temperature at each height | Compare with the dry adiabat → does the thermal keep climbing or stop |
| Dew point (Td, blue, bold) | Jagged line left of the red one | The temperature the air must cool to in order to saturate | Its distance from the red line = dryness: touching = cloud/fog |
| Lifted parcel (thin or dotted) | From the surface up a dry adiabat, then a moist adiabat | Temperature of a parcel if pushed upward | Where it is warmer than the red line = CAPE; colder = CIN |
| Wind barbs | Right-hand column; long barb 10 kt, short 5 kt, triangle 50 kt | Wind direction and speed per level | Shear, tailwind aloft, thermal drift |
Units you'll meet: wind in kt (1 kt = 1.85 km/h), pressure in hPa (= mb), height sometimes in ft (1,000 ft = 305 m).
3. The four "levels" that matter
Every thermal and storm index derives from these four levels. Once you can draw them yourself, you can read a sounding.
LCL – Lifting Condensation Level
From the surface temperature go up along a dry adiabat; from the surface dew point go up along a mixing-ratio line. Where they cross is the LCL: the cloudbase of a parcel lifted mechanically (a slope, a front). Quick estimate: LCL (m) ≈ 125 × (T – Td).
CCL – Convective Condensation Level
From the surface dew point go up along the mixing-ratio line until it crosses the environmental temperature (red) line. That is the cloudbase of cumulus produced by solar heating of the ground – the cloudbase pilots actually meet on a thermal day. The CCL is always at or above the LCL; at midday with good sun the two nearly coincide.
Convective (trigger) temperature
From the CCL go down a dry adiabat to the ground: the temperature you read is the surface temperature needed for thermals to rise freely to the CCL. Compare it with the hourly temperature forecast → you know when thermals start. Example: trigger 27°C, forecast reaches 27°C at 10:30 → lay out at 10:00.
LFC and EL – Level of Free Convection and Equilibrium Level
Above cloudbase the parcel follows a moist adiabat. The LFC is where it becomes warmer than its surroundings (from here the cloud grows on its own without the sun). The EL is where it cools back to the environment – the cloud top. EL at 3–4 km: harmless cumulus. EL at 10–12 km: cumulonimbus.
4. Reading stability: how high and how strong the thermals go
The single rule: a thermal keeps rising while it is warmer than the surrounding air, i.e. while the lifted-parcel line (parallel to the dry adiabats) stays to the right of the red line.
| Slope of the red line vs the dry adiabat | Environmental lapse rate | State | What it feels like |
|---|---|---|---|
| Steeper (leans further left) | >9.8°C/km | Superadiabatic | Very strong, rough thermals, collapses; usually only in the lowest 0–300 m at midday in the dry season |
| Parallel | ≈9.8°C/km | Dry neutral | Thermals climb steadily and don't switch off – the ideal thermal layer |
| Leans slightly right | 6–9°C/km | Conditionally unstable | Good, softer thermals; cumulus can grow if moist enough |
| Leans well right, nearly vertical | 0–5°C/km | Stable | Weak thermals that break up early |
| Leans over to the right (temperature rises with height) | Negative | Inversion | Thermals stop dead – the day's ceiling |
Quick way to find the thermal top: start from the forecast surface temperature at 13:00 (not 07:00 – the morning sounding always looks "falsely stable" because of the night inversion), draw up a dry adiabat; where it crosses the red line is the thermal top on a blue day; if it hits the CCL first, cloudbase is your ceiling.
Working height = thermal top – launch height. Under 500 m: a poor day; 1,000–1,500 m: a good day; over 2,000 m: an XC day.

5. Reading moisture: fog, cloud, blue days
The gap between the blue line (Td) and the red line (T) is the dryness of that layer.
- The two lines glued together from the ground up to 1–2 km: saturated air, fog or overcast low stratus. Typical of Sapa in winter–spring and the Red River delta in February–March. No flying.
- 2–5°C apart low down, touching at 1,500–2,500 m: nice cumulus with bases at the level where they touch. A thermal day with clouds marking the lift.
- Far apart through the whole lower layer, never touching: a "blue" day – thermals without clouds, harder to find, but no risk of over-development.
- Touching in the mid levels (3–6 km): altocumulus / altostratus cutting the sun, thermals weakening from midday.
- Blue line hugging the red line from the ground up to 500 hPa: deep moist tropical air – fuel for afternoon storms.
Two indices often printed alongside: PW (precipitable water): under ~20 mm is dry, over ~45 mm is "water-loaded"; a Vietnamese summer typically runs 50–60 mm. RH 850–500 hPa: above 70% in the mid levels means cumulus easily spreads into sheets that block the sun.
6. Reading storms: CAPE, CIN and the lid
On the sounding, CAPE is the area between the lifted-parcel line and the red line where the parcel is warmer than the environment (from LFC to EL). CIN is the opposite area low down – the "lid" that must be broken before convection fires.
| CAPE (J/kg) | LI (°C) | Reading for paragliding |
|---|---|---|
| 0–300 | > +3 | Stable, no storms; light thermals |
| 300–1,000 | 0 to –3 | Good thermal day, benign cumulus; watch after 13:00 |
| 1,000–2,500 | –3 to –6 | Afternoon storms very likely; fly mornings, land by 12:00–13:00 |
| > 2,500 | < –6 | Don't fly, or fly early and land by 11:00 |

Three lid shapes to tell apart:
- Thin lid, breaks early (CIN near 0 from the morning): cumulus from 09:00–10:00, over-development at 11:00–12:00, scattered storms but rarely violent. Fly early, then land.
- Thick lid, large CAPE ("loaded gun"): the red line has an inversion at 1.5–3 km sitting on hot humid low-level air; the sky stays clear blue until 13:00–14:00, then the lid breaks and all the energy releases at once – the fastest, most violent storms. This is the day that fools the most pilots: a perfect morning, a deadly afternoon.
- Thick lid, small CAPE: clear sky, compact thermals under the lid, no storms. A great day for tandem passengers.
Two more indices usually printed: K-index above 35 means air-mass storms are very likely; Total Totals above 50 means organised storms. For paragliding these only confirm CAPE; they don't replace looking at the shape of the lid.

7. Reading the wind: the barb column
- Steady increase, steady clockwise turning with height: normal; thermals lean gently downwind.
- A jump of >15 kt between adjacent levels or a turn of >60°: a shear layer – note its height and fly the wing actively through it. Shear often coincides with an inversion.
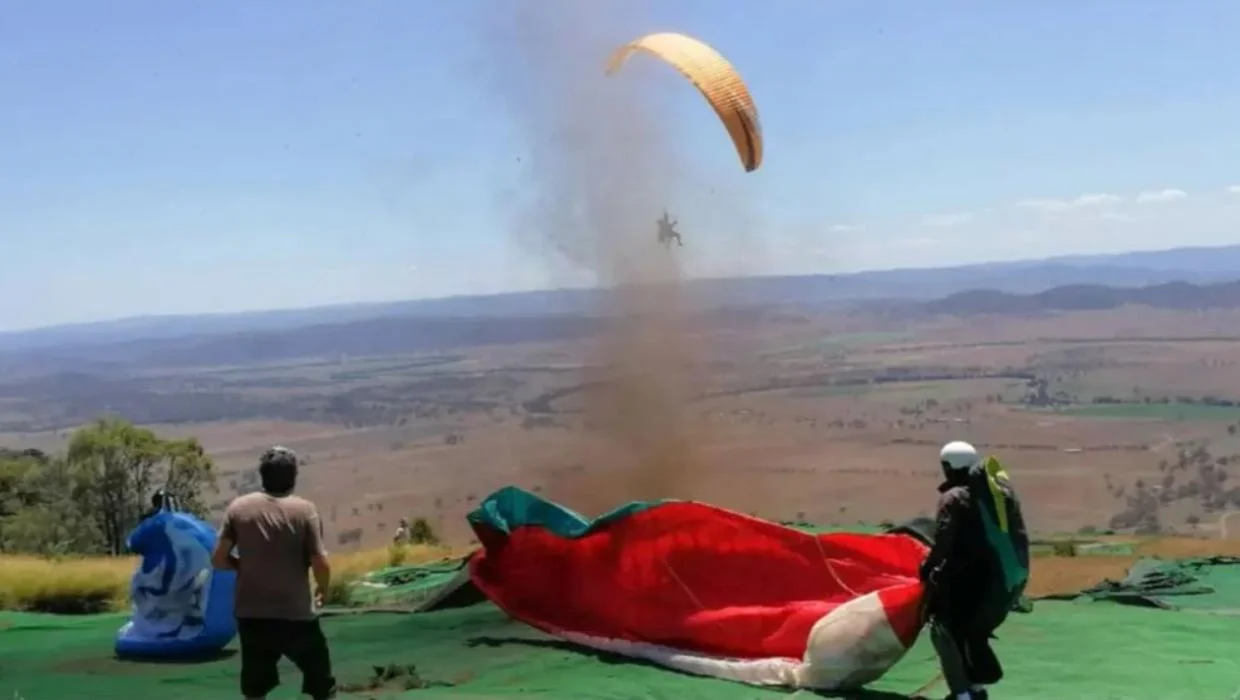
- Upper wind opposing the slope wind (surface southwest, 850 hPa northeast): climbing means a tailwind aloft and rotor in between. The classic post-cold-front picture at Khau Pha and Sapa.
- 850 hPa wind > 20 kt (37 km/h): a strong-wind day even if the surface is calm in the morning; thermals will drag it down at 11:00–13:00.
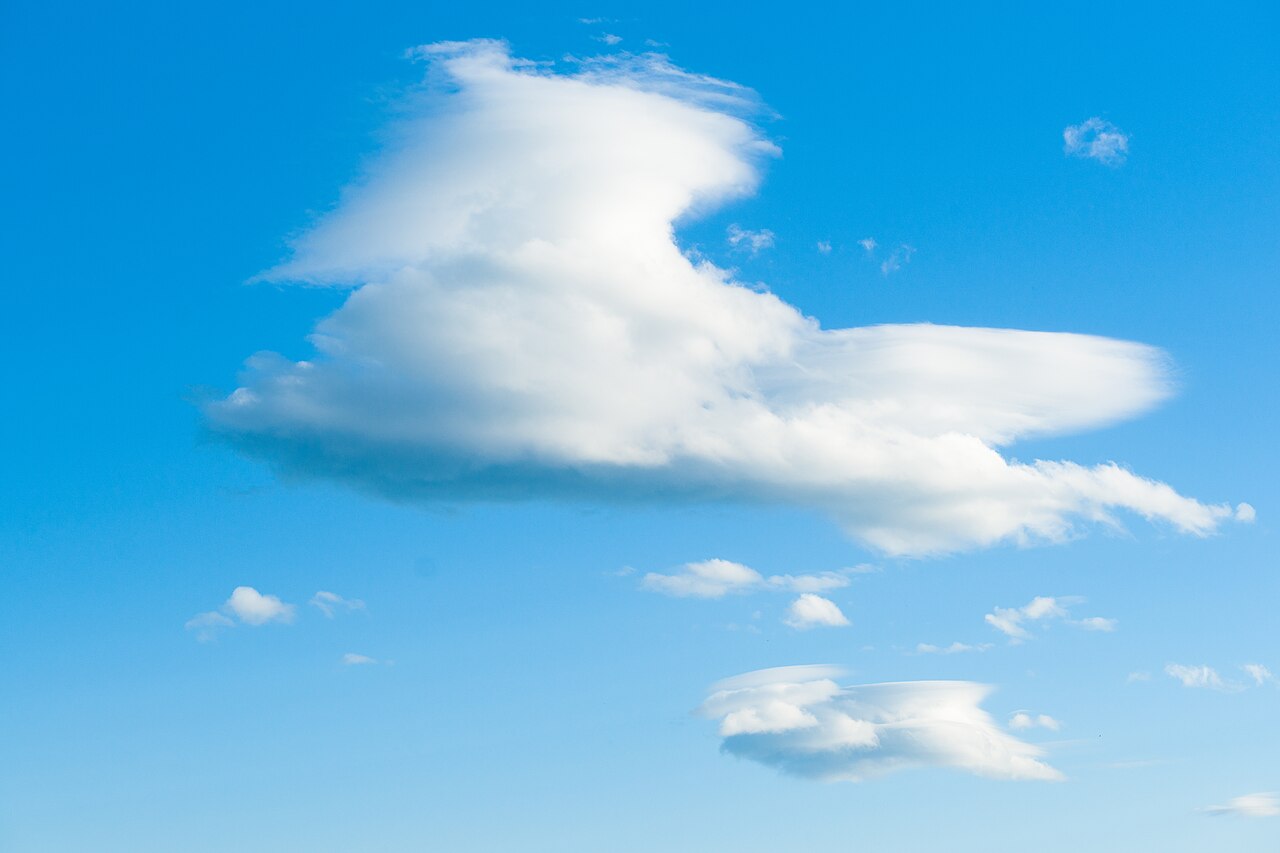
- Wind increasing steadily from the ground to 3 km, same direction: a mountain-wave day if a ridge lies across the wind; look for lenticularis.
8. Reading a sounding in 60 seconds
- Set the mark: pick 13:00, note surface T and Td.
- Thermal top: from T go up a dry adiabat; where it crosses the red line → subtract launch height.
- Cloudbase: from Td go up a mixing-ratio line to the red line (CCL). Below the thermal top → clouds mark the lift; above it → blue day.
- Start time: from the CCL go down a dry adiabat → trigger temperature → look up when it's reached on the temperature chart.
- Lid: does the red line lean right anywhere at 1.5–3 km? If yes → read CAPE to know what the lid is holding down.
- Cloud top: from the CCL follow a moist adiabat until it recrosses the red line (EL). Above 6 km with CAPE > 1,000 → afternoon storms.
- Wind: scan the barb column from the ground to the thermal top for jumps.
- One-sentence conclusion: "Thermals from 10:30, cloudbase 2,300 m, thermal top 2,100 m, weak lid, EL 7 km, CAPE 1,400 → fly 10:30–12:30, land by 13:00."
9. Three sample soundings from Vietnam
A good winter day (2–4 days after a cold front, the cold high weakening): red line sloping well from the ground to 1,500–2,000 m then kinking sharply right (the high-pressure inversion), blue line 8–12°C from the red, CAPE ≈ 0, northeast wind 10–15 kt easing with height. Compact, smooth thermals, low ceiling, no storms. The ideal tandem day.
A typical summer day (May–August): red and blue lines hugging each other from the ground to 500 hPa, lapse rate 6–7°C/km, CAPE 1,500–3,000, thin lid, EL 12–14 km, southwest wind 10–20 kt. Thermals from 09:00, cumulus from 10:00, over-development at 12:00, storms 14:00–16:00. Fly 08:00–11:00 only.
A Sapa fog day (January–March): red and blue lines glued together from the ground to 2,500 m, light east–southeast wind, dry above. Cloud clings to the Hoang Lien slopes all day. No flying, and no index will save it.
10. Limits of the sounding
- A sounding is for one point; it doesn't say where within a 30 km radius the storm cell will fire. Combine it with satellite and radar (Windy "Radar", NCHMF).
- A 2–3°C model error in surface temperature is a 300–500 m error in thermal top. Correct it with a real thermometer at launch.
- The sounding can't see small terrain: the afternoon valley wind, convergence on the ridge top, thermals off a rock face – that is the pilot's eyes' job.
Reading the sounding doesn't replace standing at launch watching for 20 minutes, but it tells you what to watch for.
References
- Jeff Haby, Skew-T Log-P Diagram Guide – as published on Portugal Paragliding: the basis of sections 2, 3 and 6.
- NWS Louisville – Environmental parameters and indices: CAPE, LI, K-index, Total Totals thresholds.
- Related: Paragliding weather – what does a pilot need to check? and the flying weather forecast for 7 Vietnamese sites.
- Images: Wikimedia Commons, open licences – see the link under each picture.