A paraglider has no engine, no cockpit, no radar. The only thing holding you up is moving air – and the only thing that tells you how that air will move is your ability to read the weather before you launch.
Most paragliding accidents don't come from equipment failure. They come from flying on the wrong day, at the wrong hour, or from the wrong launch for the conditions. This article covers what a pilot needs to look at – forecast sources, the basic parameters, and the convective indices and atmospheric structure – to forecast a flying day on your own, whether you're ridge soaring at Khau Pha, flying thermals at Sapa, or soaring the coast.
One principle runs through everything: the forecast is only a scenario; the observation on site is the decision. But without a scenario, you don't know what you're looking at.
1. Sources: trust no single one
There is no "correct" app for paragliding. Every source is just a numerical model (ECMWF, GFS, ICON, AROME…) drawn with a different interface. Good pilots look at 2–3 independent models, find where they agree and where they disagree; the disagreement is exactly where the uncertainty lives.
| Source | Model / data | What it's for | Note |
|---|---|---|---|
| mebayluon.com/thoi-tiet-bay | ECMWF (the same model Windy shows), at the exact launch coordinates | 10-day table for 7 Vietnamese sites (Khau Pha, Bu Hill, Muong Hoa – Sapa, Son Tra, Phinh Ho, Quan Ba, Khau Pha PPG): pressure, surface wind, 925/850/700 hPa wind, wind shear, CAPE, thermal ceiling, cloud, rain, storm risk – colour-coded green/yellow/red | The parameters in this article already condensed per site; use it as the starting point, then open Windy/meteoblue to dig deeper |
| Windy.com | ECMWF, GFS, ICON, AROME (Europe) | The overview: surface wind, wind by level (950–500 hPa), cloud, rain, CAPE, sounding | Global models, 9–13 km grid, can't see small mountain terrain |
| meteoblue – Air / Multimodel | Multiple models + dedicated flying products | Air chart: thermals, cloudbase, boundary layer, lapse rate; compare several models at once | Best flying product in the free/cheap tier (thermal docs) |
| XC Skies | Own model (built on GFS/HRRR…) | XC-specific: thermal top, top of lift, thermal strength, wind by level, flying indices | Paid, expert interface (layer docs) |
| SkySight | Own high-resolution model | Thermals, convergence, ridge lift, cumulus, even predicted XC distance | Paid; covers Southeast Asia; best for long XC days |
| Windguru / Windfinder | GFS, ICON, WRF | Hourly wind table, gusts, direction – quick multi-day view | Good for coastal and ridge soaring; weak on thermals |
| Vietnam National Center for Hydro-Meteorological Forecasting | Official Vietnamese forecast | Warnings for thunderstorms, heavy rain, cold surges, monsoon, typhoons | The only source with province-level warnings; always read it in the rainy season |
| Himawari satellite (via Zoom Earth or Windy) | Real imagery, 10-minute updates | See where real clouds are moving, where storms are forming | Observation, not forecast – most trustworthy for the next 1–3 hours |
| Wind station at the site (Holfuy, Windy station, DIY station) | Direct measurement | Verify the forecast right at launch | If your site has no station, install one – the cheapest safety investment there is |
How to combine them in practice:
- The evening before: check the 2–3 day trend on Windy (ECMWF) + meteoblue Multimodel. Any front, storms, monsoon surge?
- Morning of the flight: re-check the latest model run (00Z/06Z), the sounding, the satellite.
- Before heading up: read the site wind station, call the pilots already at launch.
- At launch: observe for 15–20 minutes before unpacking. Observation beats the model.
2. The parameters to watch
A flying day is decided by about 8 numbers. Reading all 8 hour by hour (not the daily average) is the minimum before every flight. The thresholds below are for commercial tandems and EN-A/B pilots; experienced XC pilots can stretch them, but not by much.
| Parameter | Where | Reference threshold | Why it matters |
|---|---|---|---|
| Surface wind (10 m) | Windy, Windguru, wind station | Good: 8–20 km/h. Caution: 20–28 km/h. No fly: >30 km/h | A paraglider flies at ~38–40 km/h; above 30 km/h you're near zero penetration and easily blown back ("parked") |
| Gusts | Windy, Windguru (gust column) | Gust minus mean <10 km/h is fine; >15 km/h means turbulent air | Gusts well above the mean = mechanical turbulence or broken thermals, collapse risk |
| Wind direction | All | Must be within ±30–45° of the launch aspect | Cross wind reduces ridge lift; tailwind means no launch (see section 4) |
| Wind aloft | Windy (950/925/900/850/800/700 hPa), meteoblue Air, XC Skies | Gradual increase with height is normal; a jump >15 km/h in 300–500 m or a turn >60° is a warning | See section 5 |
| Cloud (low/mid/high cover) | Windy "Clouds", meteoblue Air, satellite | Small cumulus 2–4/8 is ideal; overcast low cloud = no thermals; vertically developing cumulus = dangerous | See section 6 |
| Rain / humidity | Windy "Rain", NCHMF | Rain means no flying; 850 hPa humidity >80% signals low cloud, low cloudbase | See section 3 |
| Temperature & dew point | Windy, meteoblue | The larger T – Td, the higher the cloudbase (roughly 125 m per 1°C of spread) | Small spread = low cloud, moist air, easy over-development |
| Pressure & trend | Windy "Pressure", NCHMF | Fast fall (>3 hPa/3 h) = a bad system on the way | Stable high pressure usually gives calm days but can cap thermals with an inversion |
Two notes when reading the table:
- Model wind is valley-floor wind, not launch wind. Wind crossing a summit, a saddle or a pass is typically 1.3–2× the forecast (Venturi compression). Windy says 15 km/h; the pass may see 25 km/h.
- Read by the hour, not by the day. A "15 km/h day" can be 5 km/h at 8 am and 28 km/h at 2 pm. The safe window is usually only 2–4 hours long.
3. Is rain really the biggest worry?
No. Rain is the most visible thing, so beginners look at the rain icon on their phone to decide whether to fly. But rain itself is only a symptom – what matters is what produced it.
What rain does to a paraglider:
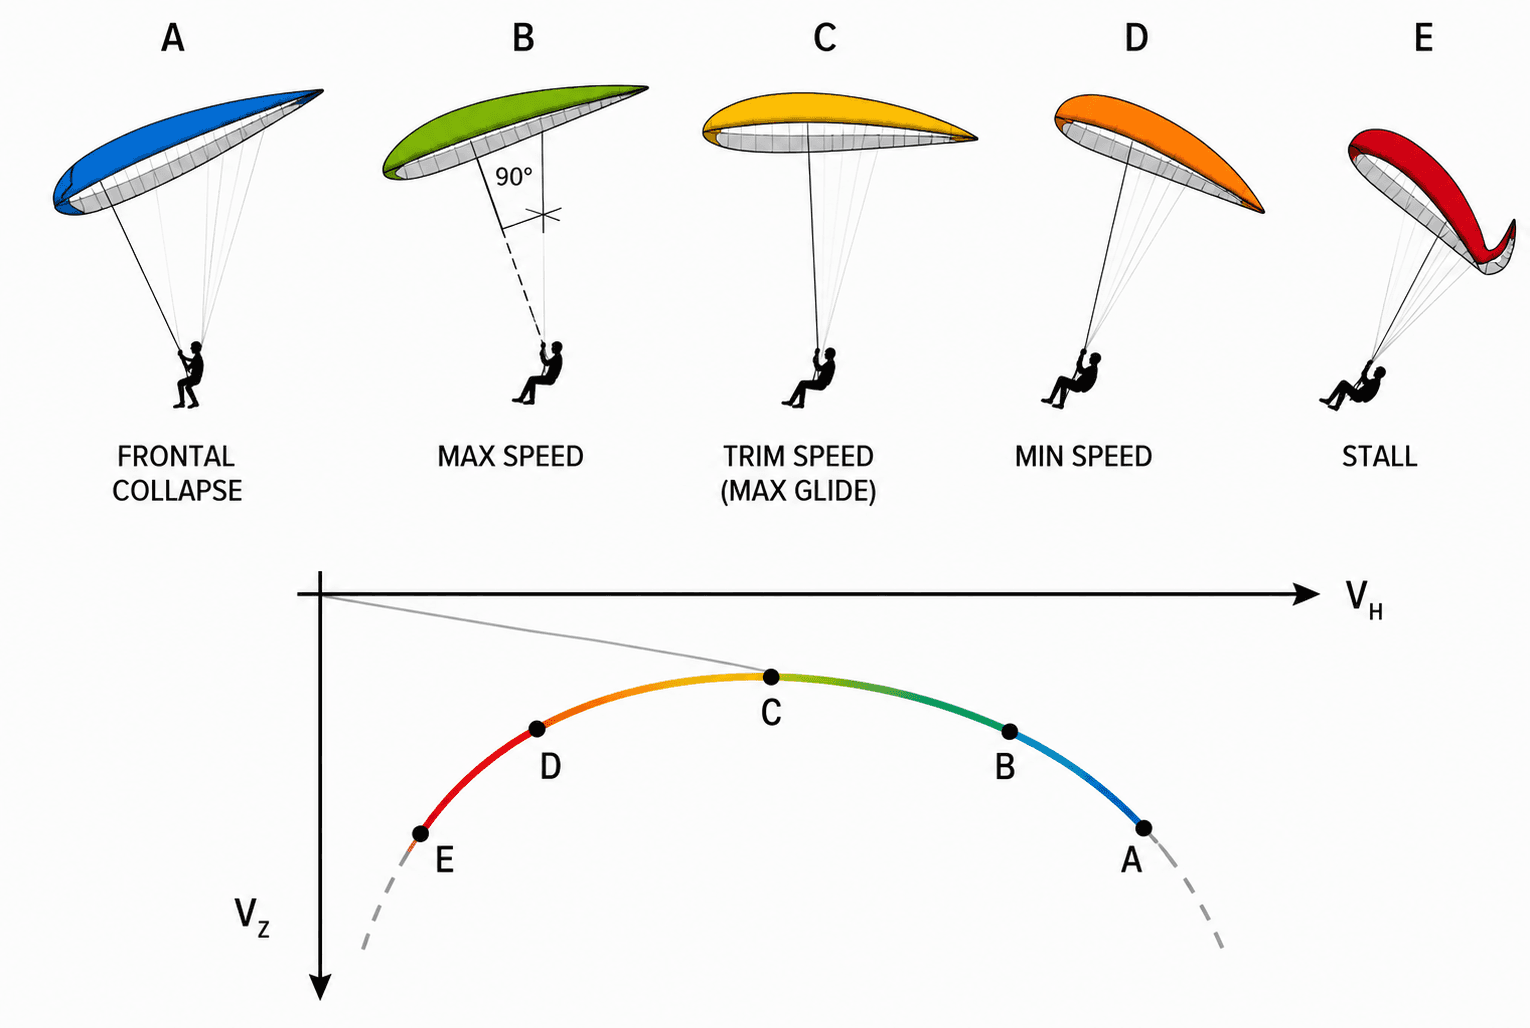
- Wet fabric gets heavier, the airfoil deforms, and the wing slips easily into a parachutal stall (no forward speed, sinking straight down) that is very hard to recover from. This is why you never fly in rain, not even drizzle.
- Visibility drops; you lose the landing field.
But three things are far more dangerous than rain, because they show no icon in the app:
- A storm building 20–40 km away. Before rain reaches you, that cloud is already pulling in air from far away (gust front, sudden wind shift, lift you can't escape – cloud suck). The app says "no rain" at your site, but you're inside its zone of influence.
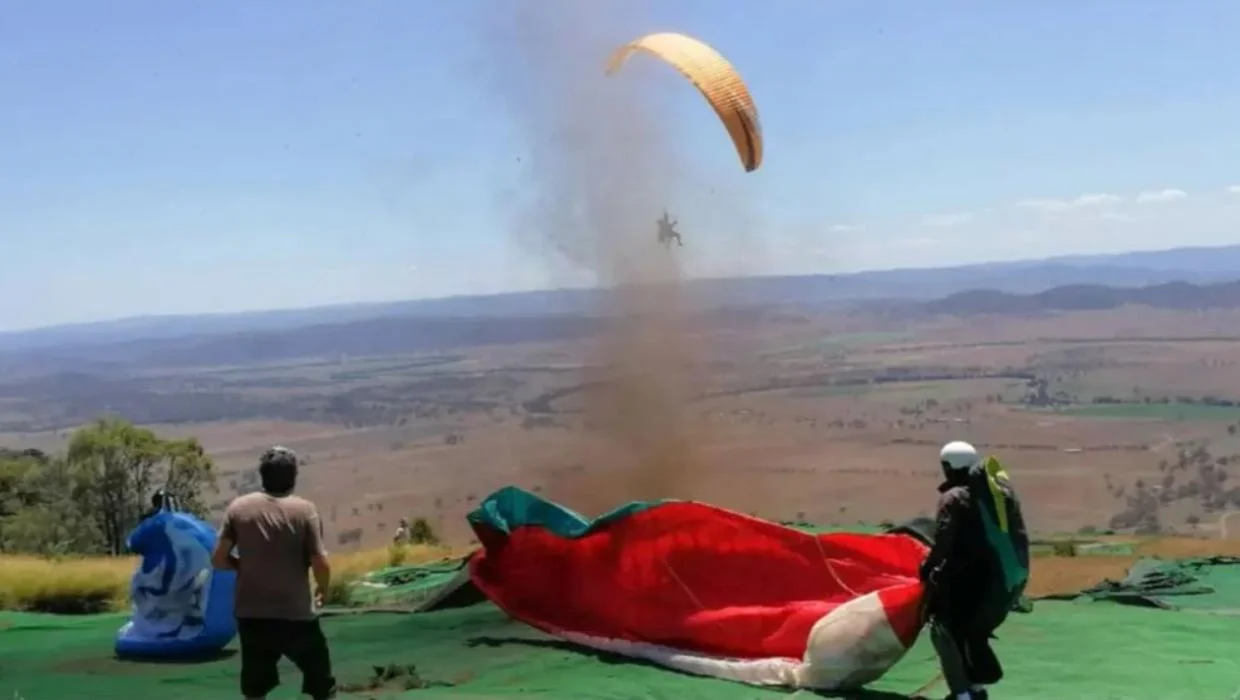
- Strong or turbulent wind on a beautiful sunny day. Blue sky, 0% rain, but 40 km/h at 850 hPa pouring over the pass. This is the scenario behind most accidents at Vietnamese mountain sites.
- Overly strong midday thermals (dry season, clear sky, steep lapse rate): "torn" air, asymmetric collapses.
The right way to read rain: don't look at the icon, look at the type of rain. Steady rain from stratiform cloud (stratus, nimbostratus) = a stable day, unflyable but not dangerous. Showers from convective cloud (cumulonimbus) = an unstable day that can be beautiful at 9 am and deadly at 2 pm. Use "Rain, thunder" on Windy and CAPE (section 9) to tell them apart.
4. Tailwind, turbulence, wind shear
These three cause most launch incidents and collapses near terrain. What they share: apps rarely report them directly – the pilot has to infer them from wind direction, terrain and the wind profile by level.
Tailwind (wind from behind)
Wind coming from behind launch, crossing the summit and pouring down the slope. Consequences: you need a much faster run, the wing won't come up, and above all the air is descending – no ridge lift, only sink and rotor.
- A light tailwind (3–5 km/h) sometimes appears early morning from katabatic drainage – wait 1–2 hours for the sun and it usually reverses.
- A tailwind caused by upper wind direction (e.g. a northeast monsoon on a southwest-facing launch) is a tailwind all day – there is nothing to wait for.
- The trap: light wind in your face at launch while high clouds move the other way, or the landing-field windsock points elsewhere. That is a tailwind creating rotor that curls back up the slope – launching into it is launching into a vortex.
Turbulence and rotor
Air crossing an obstacle (summit, treeline, buildings, rock outcrop) separates and rolls into eddies on the lee side. The rotor zone extends 5–10 times the obstacle height downwind, and the stronger the wind, the more violent it is.
- Three sources of turbulence: mechanical (terrain), thermal (broken thermals, the thermal/sink boundary), shear (two wind layers rubbing against each other).
- On the app: gusts 10–15 km/h above the mean are the best indirect indicator of turbulence. 15 km/h gusting 30 is more dangerous than a steady 22 km/h.
- On the terrain: wind more than 45° off the slope, or another ridge standing upwind of launch within a few km, means launch is in that ridge's rotor.
- Thermal turbulence peaks 11 am–3 pm in the dry season; mechanical turbulence doesn't care what time it is, only how strong the wind is.
Wind shear
A sudden change in wind speed or direction between two altitudes (vertical shear) or two locations (horizontal shear). When the wing crosses that boundary, its relative airspeed changes instantly: the wing depressurises or gets shoved, front collapse or asymmetric.
- On Windy: slide the altitude bar Surface → 950 → 925 → 900 → 850 hPa (roughly 0 / 500 / 750 / 1,000 / 1,500 m). A jump >15 km/h or a turn >60° between adjacent levels is a shear layer.
- On the sounding (meteoblue Air / Windy Sounding): the wind barb column on the right; where the barbs turn sharply is shear.
- Shear often rides on an inversion: warm air over cold, the two layers can't mix. Climbing through an inversion in a thermal usually gives a strong "shudder" at exactly that height.
- Typical horizontal shear in Vietnam: the afternoon sea-breeze / land-breeze boundary, and the gust front ahead of a storm (section 9).
The short rule: tailwind – don't launch; turbulence – fly away from terrain; shear – know its altitude in advance and fly the wing actively through it.
5. Wind aloft
Surface wind is only what you feel standing at launch. The wind you'll be flying in is at 500–2,000 m above ground – and it is almost always stronger. At night and early morning, the surface layer is "locked" under an inversion and stays calm; once the sun heats the ground, thermals mix the layers and drag the upper wind down to the surface. This is why so many sites are "8 km/h in the morning, 30 km/h at noon" without the surface app making it obvious.
The levels to check
| Pressure level | Approx. height | Meaning for paragliding |
|---|---|---|
| Surface / 10 m | 0 m | Launch and landing wind |
| 950 hPa | ~500 m | Wind just above lowland and coastal launches |
| 925 hPa | ~750 m | Launch altitude of many low hill sites |
| 900 hPa | ~1,000 m | Wind at the altitude of Khau Pha Pass (launch ~1,200 m) |
| 850 hPa | ~1,500 m | The most important level: wind in the thermal layer, wind at Sapa, the wind that "comes down" at midday |
| 800 hPa | ~2,000 m | Thermal top on a good day in the northern mountains |
| 700 hPa | ~3,000 m | Wind at cloudbase on a very good day; indicates where clouds and storms are heading |
Reading rules
- The 850 hPa wind is your "noon wind". If 850 hPa is >30–35 km/h, even with a 10 km/h surface forecast in the morning, treat it as a strong-wind day and fly only early or late.
- Gradient: surface-to-850 difference under 15 km/h is a smooth day; 15–25 km/h needs experience; above 25 km/h means guaranteed turbulence when thermals break the inversion.
- Turning with height: wind veering clockwise with altitude (northern hemisphere) is normal. A turn >90° within 1,000 m means thermals lean, drift, are hard to core and push you somewhere you didn't plan.
- Upper wind opposing the slope wind (e.g. surface southwest from anabatic flow, 850 hPa northeast from the monsoon): climbing means a tailwind up high and rotor in between. The classic scenario at northern sites from October to March.
- Check on Windy with the altitude slider at the right; see the whole profile at once with Windy Sounding or the meteoblue Air chart (wind arrows by height and hour).
6. Clouds
Clouds are a map of what the air is doing, drawn on the sky for free. A pilot who reads clouds knows without an app whether there are thermals today, how strong, and how long until it's time to land.
| Cloud type | What you see | Meaning for the day |
|---|---|---|
| Cumulus humilis (small flat-based cotton cumulus) | Scattered 2–4/8, all bases at the same height | The best day. Each cloud is the top of a thermal; cloudbase = your ceiling |
| Cumulus mediocris / congestus (as tall as wide or taller, cauliflower tops) | Rapid vertical growth after 11 am | Strong thermals, about to over-develop. Flyable, but keep distance from base and be ready to land |
| Cumulonimbus (anvil top, dark grey, thunder) | One is enough | No flying within 30–50 km. The gust front arrives 10–30 minutes before the rain |
| Stratus / stratocumulus (overcast low layer) | Uniform grey, no sun shadows | No thermals; ridge soaring only if the wind is steady; base below launch means no flying |
| Altocumulus / altostratus (mid-level, mackerel or thin veil) | 50–100% cover at 3–6 km | Cuts the sun, thermals weaken noticeably. Morning mackerel sky (altocumulus castellanus) signals unstable mid-levels – afternoon storms |
| Cirrus (high wispy ice cloud) | Thin, 8–12 km | Little effect; thickening through the day means a warm front within 12–24 hours |
| Lenticularis (smooth lens-shaped) | Stationary over a summit | Very strong wind aloft, mountain wave, violent rotor below. Don't fly even if the surface is calm |
Three cloud numbers to pull from the app
- Cloudbase (convective cloud base): the thick black line on meteoblue Air, the "Cloudbase" layer on XC Skies. The higher above launch, the bigger the day. Quick estimate: cloudbase (m) ≈ 125 × (T – Td) + station elevation.
- Cover per layer by hour: Windy "Clouds" splits low/mid/high. Low cloud >60% before 10 am = late or no thermals.
- When cumulus starts and when it goes vertical: meteoblue Air draws convective cloud by hour. If convective cloud reaches 4–5 km before 1 pm, the afternoon will over-develop.
Over-development (OD) and cloud suck
OD is when cumulus spreads out and blocks the sun ("switching off" thermals) or towers into storms. Signs 30–60 minutes ahead: bases darken, cloud edges lose definition, one cloud stands much taller than the rest. Cloud suck is the pull under a growing cloud base – 3–5 m/s or more, not escapable with big ears. Stay at least 300–500 m below base on developing days; when clouds elsewhere have turned dark, descend even if yours still looks fine.
7. Fronts
A front is the boundary between two air masses of different temperature and humidity. In Vietnam the front that matters most for paragliding is the cold front that comes with each cold surge from October to April; NCHMF calls it "strengthening cold air". Each surge is a 3–7 day cycle every northern pilot should know by heart.
The cycle of a cold surge in northern Vietnam
| Phase | Weather | Flyable? |
|---|---|---|
| 1–2 days before the front | Warm, humid, S–SE wind, increasing mid-level cloud, falling pressure | Usually flyable but weak thermals, low base; pre-frontal storms possible in the afternoon |
| Frontal passage (a few hours) | Sudden shift to N–NE, gusts 40–60 km/h, showers, temperature drops 5–10°C | No flying. The strongest horizontal shear of the year |
| 1–2 days after | Strong NE 20–40 km/h, clear or low cloud depending on a dry or wet surge | Only NE-facing sites work, strong and rough; SW-facing sites are in full tailwind |
| 2–4 days after | Cold high weakens, wind eases, clear and dry | The best days of winter: clean thermals, high base, long visibility |
| End of cycle | Wind backs to E–SE, humidity returns, haze | Flyable but "murky"; wait for the next surge |
Warm fronts are rare at Vietnam's latitude; the closest thing is tropical moist air surging back after the cold high retreats – low stratus rolls in, drizzle, base below launch.
Spotting a front in the app
- Windy: the "Pressure" layer shows isobars bunching up from China southward; the "Temperature" layer shows a sharp gradient band; stepping hour by hour shows the wind turning from south to north.
- NCHMF: the "cold air" bulletin gives the expected arrival hour per region – more accurate on timing than global models.
- Rule: fronts arrive early more often than late. If the front is forecast for 3 pm, plan to be on the ground by noon.
Convergence – the small "front" within a day
Two winds meeting (sea breeze meeting land breeze, two valley winds meeting over a ridge top) create a long band of lift, sometimes marked by a straight line of cumulus. It's a "highway" for XC but also where the wind turns abruptly as you cross it. SkySight and XC Skies have a dedicated convergence layer.
8. It's not just the wind – it has to fit the terrain
The same forecast, "northeast 18 km/h", can be a perfect ridge-soaring day at one site and an impossible launch at a site 10 km away. Weather isn't good or bad – it either fits or doesn't fit the site you plan to fly.
Five terrain questions for every site
- What aspect does launch face, and how wide is the usable arc? A concave bowl accepts wind ±45° off; a protruding spur only ±20°. Write the number down for each site.
- What's behind launch? A higher summit behind = upper wind spilling over the top into rotor that lands right on launch when it's strong. If the summit is less than 5–10 times its height difference away, launch is in the rotor zone.
- What's in front? Another ridge upwind within 3–5 km = the air arriving at launch is already disturbed. A narrow valley in front = compressed wind, stronger than forecast.
- Which way does the valley wind run in the afternoon? In the mountains, once the sun is up, air flows from the lowlands up the valleys (anabatic / valley breeze), reaching 15–30 km/h at 1–4 pm regardless of what the model says. It can add to or oppose the synoptic wind, and decides whether the afternoon landing has a tailwind.
- Can the landing field escape rotor? A landing field tucked against the lee foot of a hill, beside tall trees or among buildings has rotor whenever wind exceeds 15 km/h.
Example: Khau Pha Pass (Mu Cang Chai)
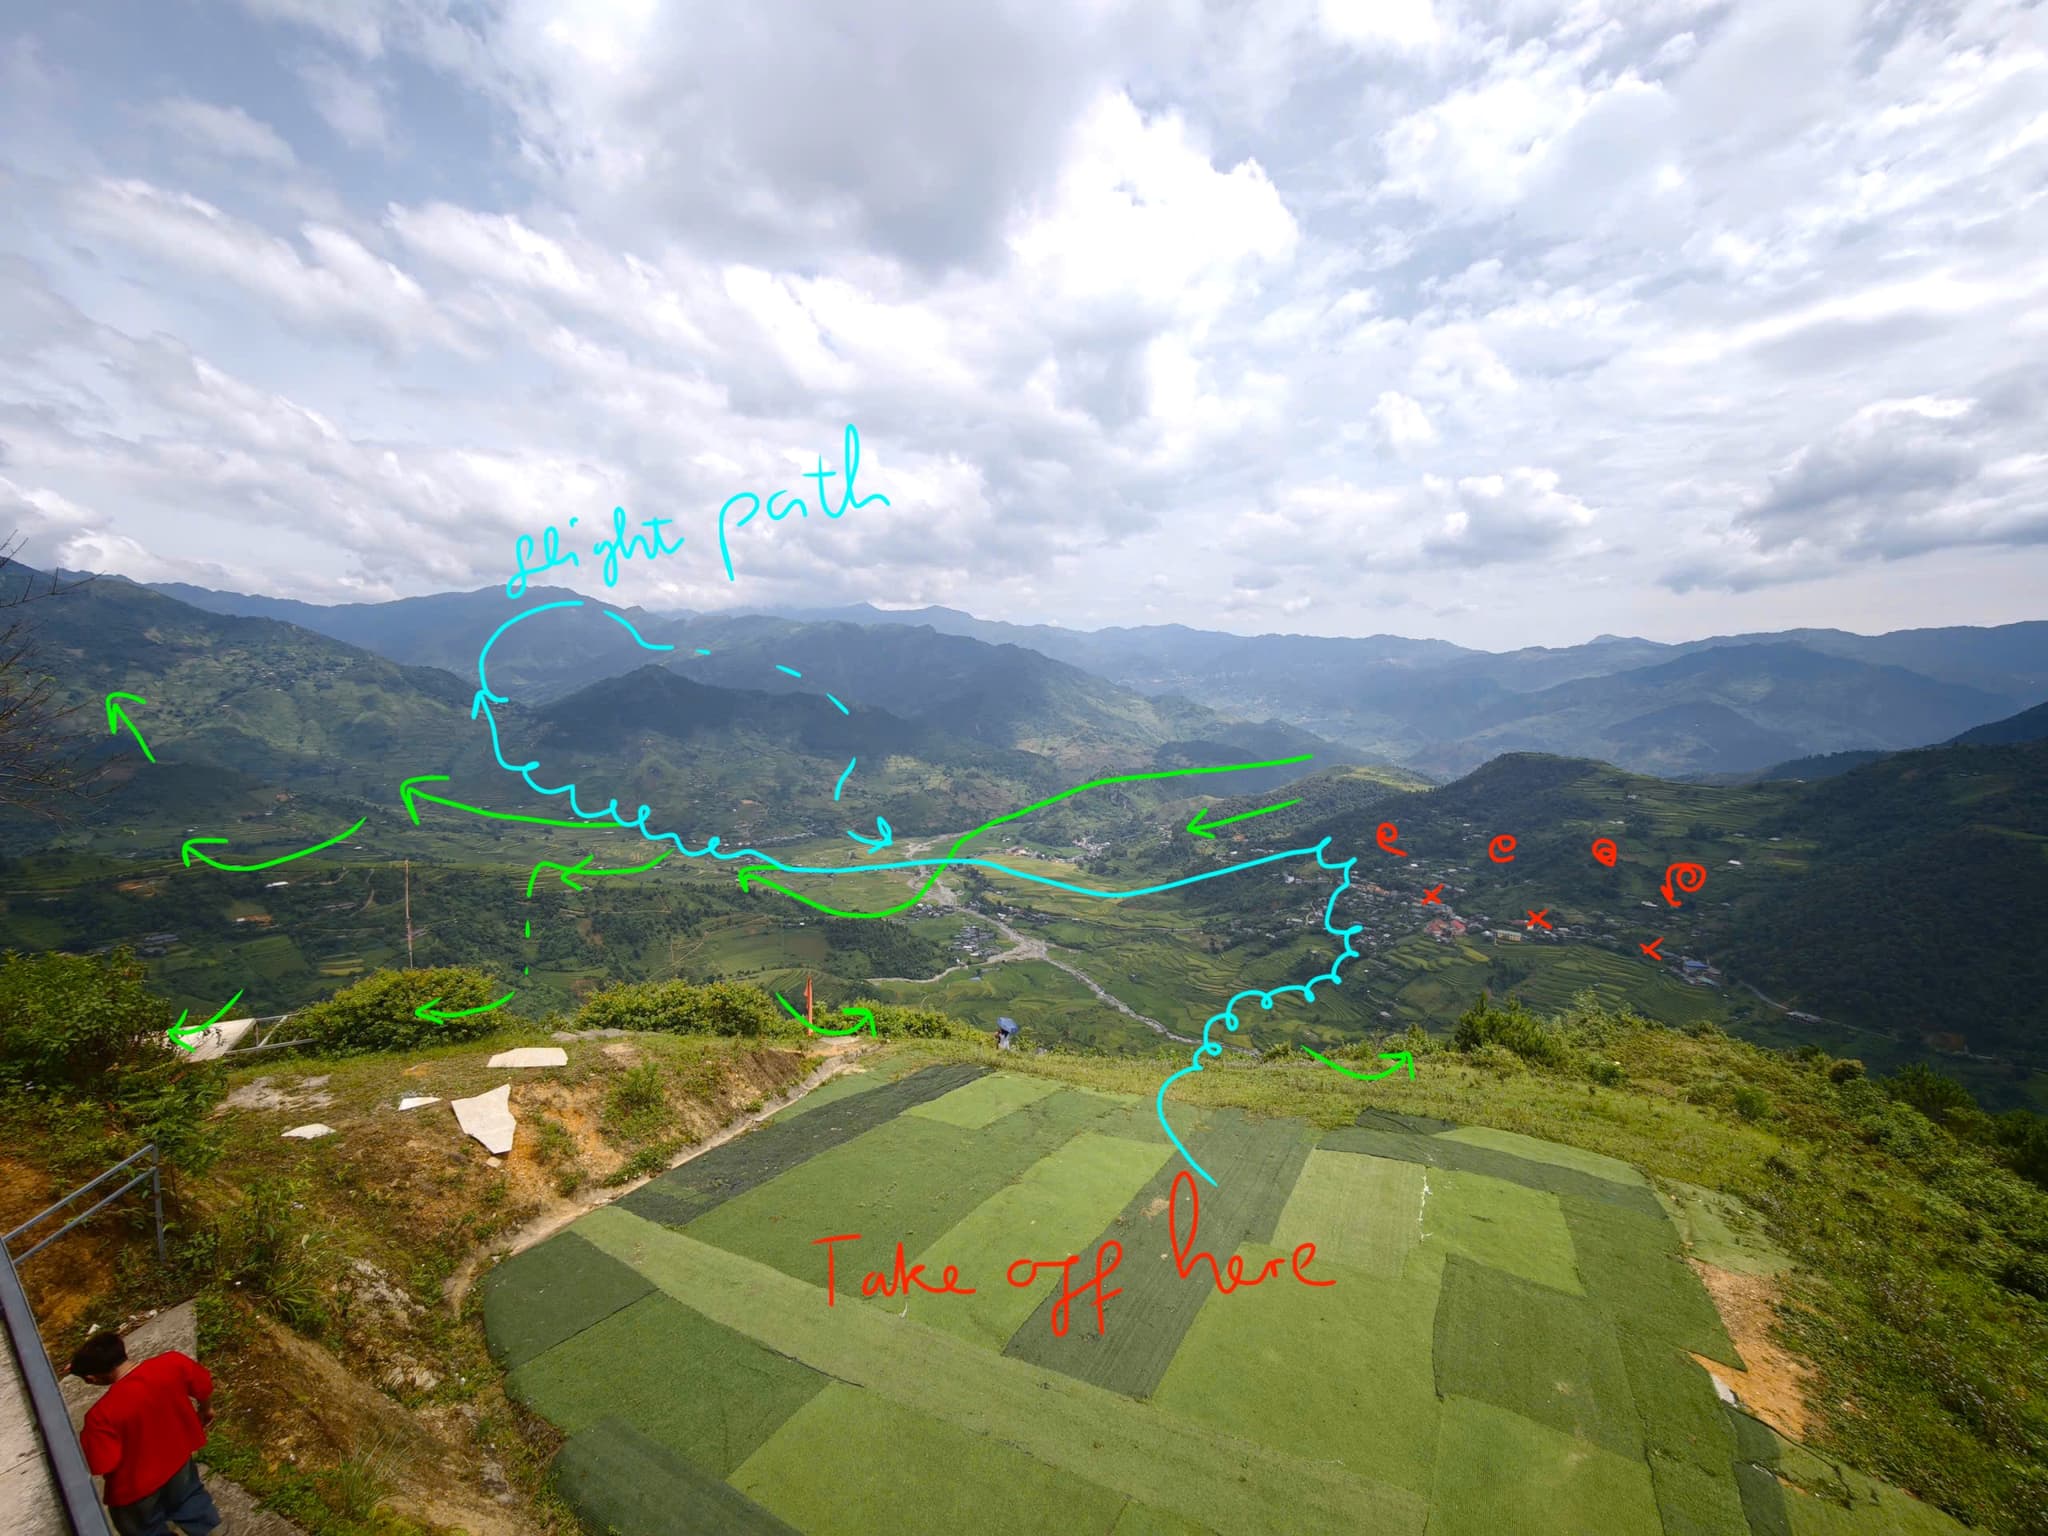
Launch on the pass at ~1,200 m, with the Lim Mong – Tu Le valley below. A typical good day: light synoptic wind; by 10–11 am the valley wind starts flowing up the sun-facing slope, thermals follow it, and you fly all afternoon. A typical bad day: post-frontal NE at 850 hPa >30 km/h – launch may still feel a light headwind from the recirculating flow, but that is rotor. A steady >25 km/h on the pass is wind compressed through the saddle; it doesn't represent the air over the valley, but it's enough to make launching impossible.
Example: Sapa
Launch at ~1,500–1,600 m, right against the 3,000 m Hoang Lien range. The 700 hPa wind acts directly; upslope fog from moist air pushed up the slope cancels more flights than wind does. T – Td under 2°C is almost certainly fog.
Example: coastal soaring
Dunes and small sea cliffs: surface and 950 hPa wind matter more than higher levels; you want a steady 15–25 km/h perpendicular to the cliff with small gusts. The sea breeze strengthens by itself in the afternoon even when the model says calm; the night and early-morning land breeze is a tailwind.
9. Storm indices: CAPE, CIN, K-index
Thunderstorms are the number-one killer in paragliding, and in Vietnam they happen almost every afternoon from April to September. The three numbers below are on Windy (the "CAPE" layer), meteoblue and sounding sites; thresholds follow the NWS reference table.
CAPE – Convective Available Potential Energy (J/kg)
CAPE measures how much energy a parcel gains if it is lifted and keeps rising on its own because it is warmer than its surroundings. The larger the CAPE, the higher and more violent convective cloud can grow.
| CAPE (J/kg) | State | Flying decision |
|---|---|---|
| 0–300 | Stable | No storm worry; thermals may be weak |
| 300–1,000 | Marginally unstable | Good thermal day; moderate cumulus growth, watch after 1 pm |
| 1,000–2,500 | Moderately unstable | Afternoon storms very likely; fly mornings only, land by 12–1 pm |
| 2,500–3,500 | Very unstable | Strong storms; consider not flying at all |
| >3,500 | Extremely unstable | No flying |
A note on the Vietnamese summer: moist tropical air gives CAPE of 1,500–3,000 J/kg on almost every day from May to August. High CAPE alone doesn't guarantee a storm – you also need a trigger (mountains, sea breeze, a front) and CIN small enough. But in the mountains the trigger is always there: it's the slope you're flying.
CIN – Convective Inhibition (J/kg, negative)
CIN is the "lid" that keeps air from rising. Large CIN (more negative than –50 to –100 J/kg) in the morning means late thermals and a long clear sky; but if CAPE is high and the lid breaks at 2 pm, all the energy releases at once – storms explode faster and harder than on a weak-lid day. CIN near 0 from the morning = early cloud growth, early OD, but usually less violent.
K-index
The K-index combines temperature and moisture at 850–500 hPa, reflecting the chance of air-mass thunderstorms – the most common afternoon storm type here. K <30 is low chance, 30–40 high chance, >40 almost certain storms with heavy rain. Combined: high CAPE + K >35 + morning mackerel sky = morning-only flying.
On-site signs that need no index
- Cumulus tops losing definition, fibrous like hair (glaciation) = it has become cumulonimbus.
- Wind suddenly shifting, turning cool and strengthening = gust front, a storm 10–30 km away is coming.
- Audible thunder = storm within 15–20 km = land now.
- Vario showing steady 2–3 m/s everywhere without searching = widespread cloud suck, the cloud overhead is becoming a storm.
10. Thermal indices
A thermal is a parcel of air warmer than its surroundings, rising from ground heated by the sun. Its strength depends on three things: sunshine (radiation reaching the ground), dry or wet ground (wet ground spends energy on evaporation instead of heating air), and whether the atmosphere lets it rise (lapse rate, section 12). Flying apps package these three into a handful of numbers.
| Index | Found on | How to read it |
|---|---|---|
| Thermal strength / updraft velocity (m/s) | meteoblue Air, XC Skies, SkySight | Expected average climb rate. Per meteoblue: minimum flyable 1.5 m/s, good 2 m/s, excellent >2.5 m/s. Above 4 m/s is a "rough" day, not for students or tandems |
| Thermal top / boundary layer height (m) | meteoblue (white line), XC Skies "Top of lift", Windy "Thermals" | Height where thermals hit the ceiling. Subtract launch altitude to get your "working band": under 500 m above launch is a poor day, 1,000–1,500 m good, >2,000 m an XC day |
| Thermal index (TI) | US-style soaring forecasts, some sounding sites | Difference between ambient temperature and the rising parcel's temperature at each height. Negative TI = still climbing; TI ≤ –3 is good; –2 to 0 weak; positive means lift stops. The height where TI = 0 is the thermal top |
| Trigger temperature (°C) | Sounding, XC Skies | Surface temperature needed for thermals to break the morning inversion. Compare with the hourly temperature forecast to know when thermals start |
| Cloudbase / convective condensation level | meteoblue (black line), XC Skies | Cumulus base. Below the thermal top means clouds mark the thermals (an easy day); above it is a "blue" day – thermals without clouds, hard to find |
| Solar radiation / sunshine (W/m²) | meteoblue, Windy "Solar" | Under 400 W/m² thermals struggle to form; >700 W/m² with dry ground = strong thermals |
Days the app promises thermals that don't show up
- 1–2 days after heavy rain: wet ground, flooded paddies – a global model doesn't know the Mu Cang Chai terraces are under water.
- Mid/high cloud arriving earlier than forecast, cutting the sun.
- An inversion right at launch height (winter, cold high): thermals exist on the plain but die before reaching launch.
- Air too moist: thermals form but turn into cloud immediately, OD by 11 am.
Conversely, when the model says 1 m/s and reality gives 3 m/s, it's usually terrain: south-facing rock slopes, harvested fields, bare ground – things a 10 km grid can't see.
11. LI (Lifted Index)
LI is the simplest number for answering "is the atmosphere stable or unstable today?". The method: take a parcel from the surface, lift it to 500 hPa (~5,500 m), and compare its temperature with the ambient temperature there.
LI = T(500 hPa, environment) – T(500 hPa, lifted parcel)
If the lifted parcel is still warmer than its surroundings, LI is negative – it will keep rising on its own, i.e. unstable. Thresholds per NWS:
| LI (°C) | State | Meaning for the day |
|---|---|---|
| > +3 | Very stable | No storms; weak or no thermals; a ridge-soaring day, smooth for passengers |
| 0 to +3 | Stable | Light to moderate thermals, small cumulus, no OD. The most comfortable day for tandems and new pilots |
| 0 to –3 | Marginally unstable | Good thermals, growing cumulus; the typical XC day, watch the clouds after noon |
| –3 to –6 | Moderately unstable | Afternoon storms likely; fly mornings, land early |
| –6 to –9 | Very unstable | Strong storms almost certain; don't fly |
| < –9 | Extremely unstable | No flying |
Using LI together with CAPE
LI and CAPE measure the same thing two ways: LI is "the temperature difference at one point", CAPE is "the total area of that difference". They usually agree, and when they disagree it's worth noticing:
- Slightly negative LI, high CAPE → the energy sits high up; if a storm fires it will be tall and violent.
- Deeply negative LI, low CAPE → low-level instability, "punchy" thermals but few storms.
For commercial paragliding the comfortable zone is LI from +3 to –2. LI below –4 in the 12:00 forecast is reason enough to move the whole passenger schedule to the morning. LI is on meteoblue (the "Air" table), on Windy when you open the sounding, on XC Skies, and on most skew-T sites.
12. Lapse rate
The lapse rate is how fast temperature falls with height, in °C per 100 m or per km. It is the root number from which every thermal index, LI and CAPE is derived. Understand it and you understand why thermals rise, stop, or turn into storms.
Three numbers to remember
| Lapse rate | Value | What it is |
|---|---|---|
| Dry adiabatic (DALR) | ~1.0°C/100 m (9.8°C/km) | How fast a dry parcel cools as it rises, from expansion. A thermal that hasn't yet formed cloud cools at this rate |
| Moist adiabatic (MALR/SALR) | ~0.5–0.6°C/100 m in a warm humid tropical climate | Once condensation begins, latent heat is released and the parcel cools more slowly – which is why cumulus can tower |
| Environmental (ELR) | Varies day to day and layer to layer; standard average 0.65°C/100 m | The actual atmospheric temperature profile, from a radiosonde or a model. This is what you read on the sounding |
The rule: a thermal keeps rising only while it is warmer than its surroundings, i.e. while ELR > DALR (the surrounding air cools with height faster than the thermal cools itself).
- ELR ≥ 1°C/100 m: superadiabatic, very strong and rough thermals; common in the lowest 0–300 m over bare ground at midday in the dry season.
- ELR 0.7–0.9°C/100 m: conditionally unstable, good and smoother thermals – the ideal zone.
- ELR 0.5–0.65°C/100 m: weak, broken thermals that die easily.
- ELR < 0.5°C/100 m or temperature increasing with height: inversion – thermals stop here. Inversion height = the day's ceiling.
Reading the sounding (skew-T)
A sounding is a plot of temperature against height; on Windy (click a point → "Sounding"), meteoblue Air, XC Skies. Each day you only need to look at 4 things:
- How the temperature line (red) slopes compared with the printed dry adiabats. Parallel or steeper = a good thermal layer. Vertical or leaning right = inversion.
- The height where the temperature line first kinks to the right = thermal top. Subtract launch height for your working band.
- The gap between the temperature line and the dew-point line (blue). Where the two touch, there is cloud. Touching below launch height = fog. Touching above the thermal top = a blue day.
- After the condensation point, does the temperature line still slope steeper than the moist adiabat? Yes, continuing to 5–6 km = clouds can grow into storms. An inversion layer at 3–4 km stopping it = clouds get "capped", a safer day.
Measuring without an app
Knowing the temperature at the landing field and at launch at the same hour gives you the local ELR. Khau Pha: landing ~900 m, launch ~1,200 m, 300 m difference. If it's 28°C below and 25°C above (3°C difference), ELR = 1°C/100 m: strong thermals. A 1°C difference: stable, smooth day. Warmer above than below: inversion, wait.
Skew-T and emagram: what that chart actually is
Skew-T log-P and the emagram are two ways of drawing the same thing: air temperature against height, with pre-printed lines showing "if a parcel rises, this is how it cools". The only difference is the axes: the emagram draws the temperature axis vertically (many European sites and meteoblue use it); the skew-T draws it tilted 45° to the right so the real temperature trace isn't squeezed into a corner (Windy, XC Skies, US sites). Read one and you can read both.
The lines on the chart and what they mean:
| Line | On a skew-T | What it is | Pilots use it to |
|---|---|---|---|
| Isobars | Horizontal, spacing shrinks with height (log scale) | Pressure levels 1000, 925, 850, 700, 500 hPa | Convert to height (table in section 5); many sites print metres on the right |
| Isotherms | Tilted 45° to the right | Equal temperature | Read °C; the 0°C line gives the freezing level |
| Dry adiabats | Gently curved, leaning left | Path of a dry parcel cooling as it rises (1°C/100 m) | The thermal's path from the ground to cloudbase |
| Moist adiabats | More curved, steeper than dry adiabats | Path of a parcel cooling after it has become cloud (0.5–0.6°C/100 m) | The cumulus path from cloudbase to its top |
| Mixing ratio (dashed) | Nearly vertical, slightly right-leaning | Water-vapour content (g/kg) | Follow it up from the surface dew point; where it crosses the dry adiabat is cloudbase |
| Environmental temperature (red, solid, bold) | Real / model data | How warm the real air is at each height | Compare with the dry adiabat to see whether the thermal keeps climbing |
| Dew point (blue, solid) | Real / model data | How moist the air is at each height | Close to the red line = cloud/fog at that level; far away = dry, clear |
| Wind barbs | Right-hand column | Direction + speed per level | Spot shear and tailwind aloft (sections 4, 5) |
Reading a sounding in 60 seconds – a 5-step routine:
- Find the starting point. Use the forecast surface temperature at 1 pm (not 7 am – the morning sounding always looks falsely "stable"). Most sites let you drag through the hours.
- Draw the thermal line. From that point go up parallel to the dry adiabats. As long as this line stays to the right (warmer) of the red environmental line, the thermal keeps rising. Where the two cross = thermal top (blue day).
- Draw the moisture line. From the surface dew point go up along the mixing-ratio line. Where it crosses the thermal line is cloudbase. If this crossing is lower than the thermal top from step 2 → today has cumulus marking the thermals.
- Continue up from cloudbase along the moist adiabat. Still right of the red line = the cloud keeps growing. The area between the moist line and the red line is CAPE – the wider and the higher it reaches toward 400–300 hPa, the more violent the storm. A red line kinking right at 3–4 km = a lid, capped clouds, a safer day.
- Look at the wind barbs on the right from the surface to the thermal top: steady increase and steady turning is fine; a jump or a reversal at one level is shear – remember that height.
Three shapes you'll see often in Vietnam:
- Red and blue lines glued together from the ground up to 1–2 km: saturated air – fog, drizzle, low stratus. Typical of Sapa in winter–spring and the Red River delta in February–March. No flying.
- Red line kinking sharply right at 1–1.5 km, dry and steep below: a cold-high inversion. Compact thermals, low ceiling but smooth, no OD. A great passenger day in winter.
- Red line sloping steadily all the way to 500 hPa, blue line hugging it: moist tropical air, no lid. Early thermals, cloud growth from 10 am, afternoon storms. The typical summer day – morning flying only.
Where to find it: Windy → click the site → "Sounding" tab (skew-T, scrub by hour, free); meteoblue → "Air" → "Sounding/Emagram"; XC Skies → "Sounding" at the point; Portugal Paragliding has a skew-T guide written specifically for paragliders with an illustration of every line.
Conclusion: the routine for forecasting a flying day
Everything above folds into a 10–15 minute habit each evening and 5 minutes each morning. The order matters: rule out the no-fly day first, then find the best hour.
The evening before – the exclusion questions
- Any front, cold surge, typhoon or low in the next 24 hours? (NCHMF, Windy Pressure)
- Does the 850 hPa wind exceed 30 km/h between 12 and 3 pm? Does its direction become a tailwind for the site?
- CAPE >1,500 J/kg or LI < –4 in the afternoon? If so, the schedule ends before noon.
- Low cloud >60% or steady rain all day?
- Do two models (ECMWF and ICON/GFS) agree on wind and cloud? If not, plan for the worse scenario.
The morning of – the window questions
- Has the new model run changed anything since last night?
- Sounding: thermal top, cloudbase, inversion height, and at what hour is trigger temperature reached?
- Surface wind and gusts by hour: from what time to what time is the 8–22 km/h window?
- Satellite: where are the clouds, which way are they moving, is anything blooming upwind?
- Does the site wind station match the model? Off by >10 km/h = the model is wrong today, trust the station.
At launch – observation beats the model
- Watch for 15–20 minutes: does the wind cycle, what's the biggest gust, does it ever swing to a tailwind?
- Clouds overhead and upwind: flat or dark bases, rounded or fibrous tops?
- Pilots already flying: smooth climbs or rough ones, any collapses?
- "Not flying" is the right decision whenever any of the signs above doesn't match the scenario you planned for.
A good pilot isn't the one who can fly in any conditions, but the one who knows in advance what the air will do today – and isn't surprised when it does exactly that.
References
- NWS Louisville – Environmental parameters and indices: LI, CAPE, K-index, lapse rate thresholds.
- meteoblue – Thermal forecast: thermal strength, boundary layer, TI, cloudbase.
- XC Skies – Layers documentation: XC data layers.
- Portugal Paragliding – Skew-T: a skew-T guide for paragliders.